Azure IoT Hub and Elasticsearch

Intro
In the previous post, I already explained how Elasticsearch is well suited for IoT data initiatives. This writeup is the first in a series to explain how one can quickly prototype an IoT platform with Elasticsearch and the IoT cloud platforms of Microsoft Azure, Amazon AWS, and Google Cloud.
There are several integrations with Azure through Logstash, Beats, and the Elastic Agent. In this example, we will be using Logstash for data resiliency reasons and to mimic a common production scenario. Data will be pulled from Azure IoT Hubs through Logstash’s Event Hub input into Elasticsearch and visualized with Kibana.
Required technologies
For a quick lab to test your envisioned IoT platform, the following technologies are required:
- Elasticsearch and Kibana - the easiest is to start a trial with Elastic Cloud or download it for free (Kubernetes also belongs to the options!)
- Azure IoT Hub (any tier will work)
- Azure Storage Account
- Azure Virtual Machine of your choice
- Logstash on your Virtual Machine
Setting up the Azure IoT Hub
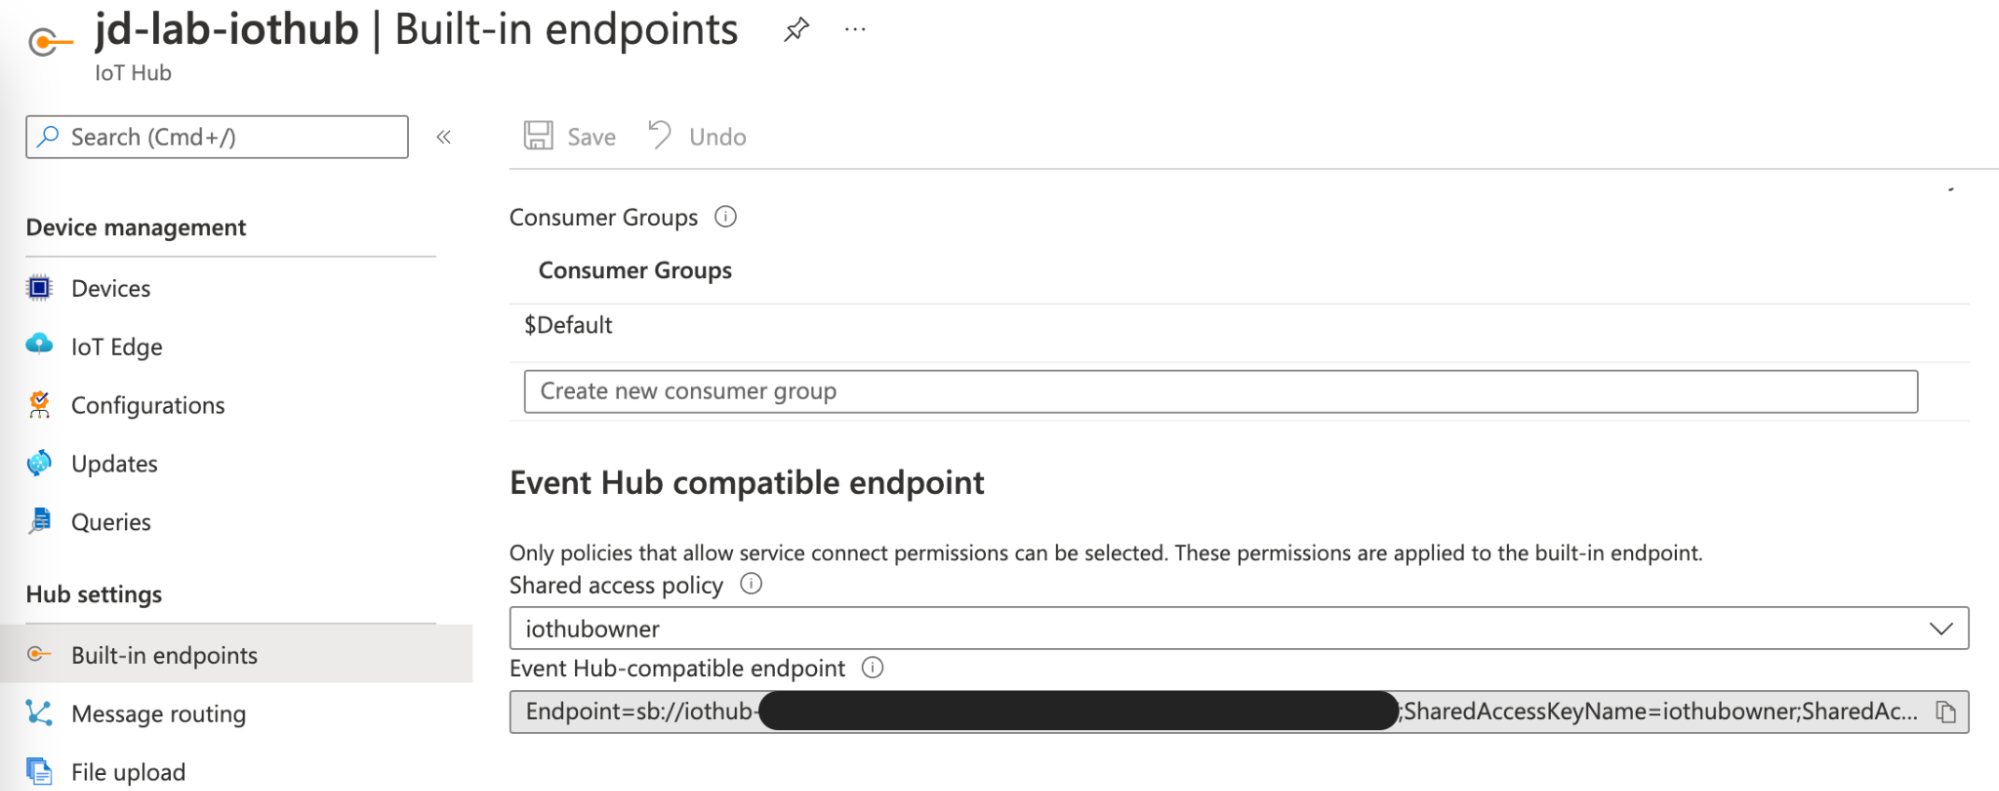
First, create an Azure IoT Hub resource through either the CLI or the Azure Portal. There is a free tier to take advantage of, which also works if you want to test the advanced capabilities such as device twin. IoT Hub is built on the same technologies as Azure Event Hubs and supports AMQP, so we don’t have to create an additional service to pick up the events from there. To connect to the IoT Hub we navigate to built-in endpoints and note down the Event Hub-compatible endpoint.

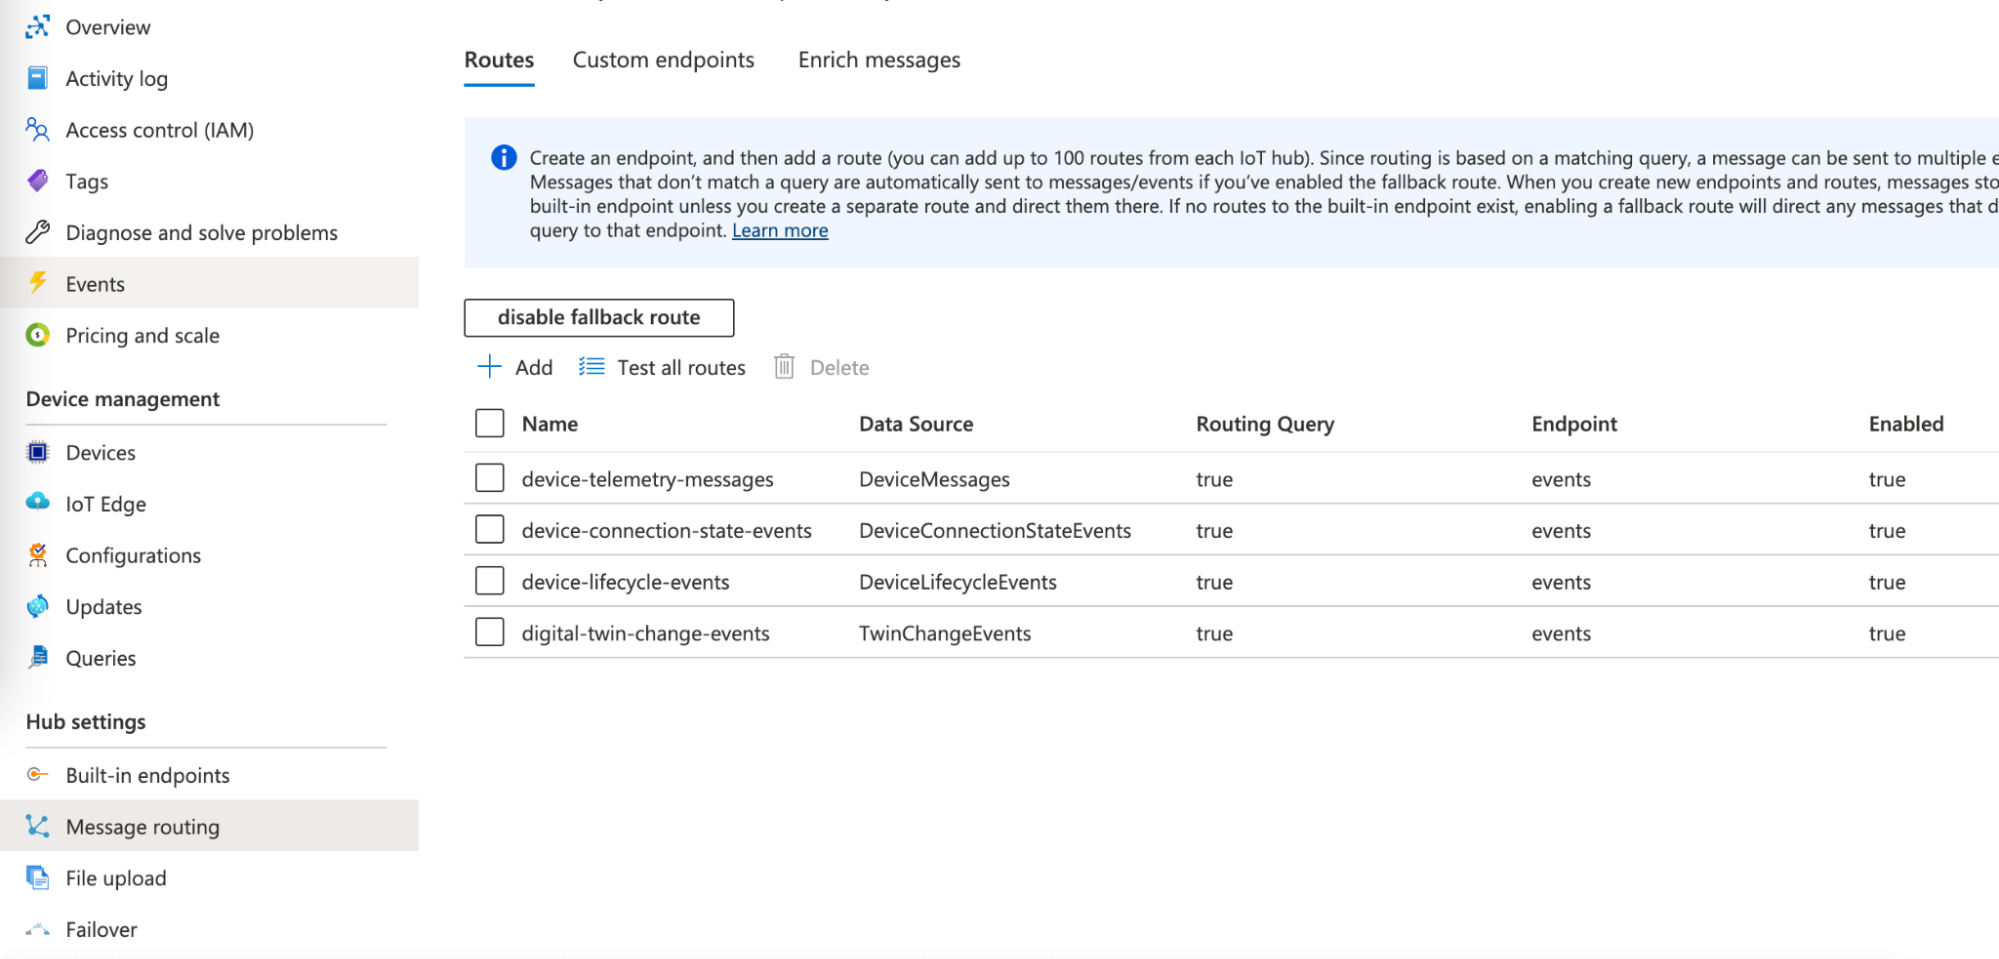
In order for us to pick up the events from there, we have to add routes for the built-in events endpoint relating to each data source that we want to ingest into Elasticsearch.

Setting up the Azure Storage Account
Next up, an Azure Storage Account is needed for Logstash to remember where to resume processing events where it left off. This one is quite straightforward, but do not forget to make note of the connection string as we need it later for Logstash to connect to it.
Setting up the VM for running Logstash
To test things out, we can just go with a 2 or 3.5GB RAM VM on Azure to run Logstash on, which will pull data from the IoT Hub, parse it, and send it through to our Elastic Cloud deployment. However, in production environments, it is recommended to set the heap size at no less than 4GB and no more than 8GB.
Installing and setting up Logstash
Download and install Logstash with your preferred download; binary, package repositories or Docker belong to the options. Before we can build the config file, we have to add the Azure Event Hubs plugin.
We can then go ahead and build the following Logstash config:
input {
   azure_event_hubs {
      event_hub_connections => ["<your-Event-Hubs-compatible-endpoint>"]
      threads => 4
      decorate_events => true
      consumer_group => "$Default"
      storage_connection => "<your-storage-acccount-connection-string>"
   }
}

filter {
  json {
    source => "message"
  }
}

output {
  elasticsearch {
    cloud_id => "<your-cloud-id>"
    cloud_auth => "<username:password>"
    index => "azure-iot"
  }
}
This configuration will pull all incoming data from Azure IoT Hub, parse its messages and send it to Elastic Cloud.
Using the Azure IoT Telemetry Simulator
The Azure IoT Device Telemetry Simulator is a great tool created by Microsoft Azure to test Azure IoT Hub and generate data with data templates to mimic your IoT environment. We can use Docker with a few commands to first generate the devices in Azure IoT Hub:
docker run -it -e "IotHubConnectionString=HostName=your-iothub-name.azure-devices.net;SharedAccessKeyName=registryReadWrite;SharedAccessKey=your-iothub-key" -e DeviceCount=15 mcr.microsoft.com/oss/azure-samples/azureiot-simulatordeviceprovisioning
And then generate device telemetry:
docker run -it -e "IotHubConnectionString=HostName=your-iothub-name.azure-devices.net;SharedAccessKeyName=device;SharedAccessKey=your-iothub-key" mcr.microsoft.com/oss/azure-samples/azureiot-telemetrysimulator
There is also the possibility to use templates and variables in a file, which makes it easier to set up and manage. I have created a simple file to generate location data for employees (engineers and managers) who are moving around an industrial setting as well as two cranes that are servicing materials to ships along the canal.
The JSON file looks as follows:
{
 "Variables": [
   {
     "name": "latitude",
     "min": "52.07922",
     "max": "52.08122",
     "randomDouble": true
   },
   {
     "name": "longitude",
     "min": "5.07726",
     "max": "5.07925",
     "randomDouble": true
   },
   {
     "name": "employeelocation",
     "values": ["$.latitude", "$.longitude"]
   },
   {
     "name": "active",
     "values": ["true", "false"]
   },
   {
     "name": "status",
     "values": ["idle", "in transit", "observing", "observing", "observing", "repairing", "idle", "in transit"],
     "sequence": true
   },
   {
     "name": "orientation",
     "min": "0",
     "max": "360",
     "random": true
   }
 ],
 "Payloads": [
   {
     "type": "template",
     "template": {
       "time": "$.Epoch",
       "deviceId": "$.DeviceId",
       "type": "employee",
       "subtype": ["engineer", "manager"],
       "location": "$.latitude, $.longitude",
       "status": "$.status"
     }
   },
   {
     "type": "template",
     "deviceId": "sim0000011",
     "template": {
       "time": "$.Epoch",
       "deviceId": "sim0000011",
       "type": "asset",
       "subtype": "crane",
       "asset_name": "crane-dx1",
       "location": ["52.080640,5.079709"],
       "active": "$.active",
       "orientation": "$.orientation"}
   },
   {
     "type": "template",
     "deviceId": "sim0000012",
     "template": {
       "time": "$.Epoch",
       "deviceId": "sim0000012",
       "type": "asset",
       "subtype": "crane",
       "asset_name": "crane-dx2",
       "location": ["52.079950,5.079978"],
       "active": "$.active",
       "orientation": "$.orientation"}
   }
 ],
 "MessageCount": 100,
 "DeviceCount": 12,
 "Interval": 20000
}
And we can run Docker with the following parameters to mount this file in the container:
docker run -it -e "IotHubConnectionString=<your-IoT-Hub-connection-string>" -e "File=/config_files/AzureIoTTelemetrySimulator.json" --mount type=bind,source=/path/to/folder,target=/config_files,readonly mcr.microsoft.com/oss/azure-samples/azureiot-telemetrysimulator
Ingest the IoT data into Elasticsearch and visualize with Kibana
Now everything is set up to start ingesting the data into Elasticsearch. First, we run Logstash with the config file:
bin/logstash -f <your-config-file>.conf
And then we start the Docker container with the command above. We will soon see the data flowing into Elasticsearch, which we can easily check with Kibana data management.

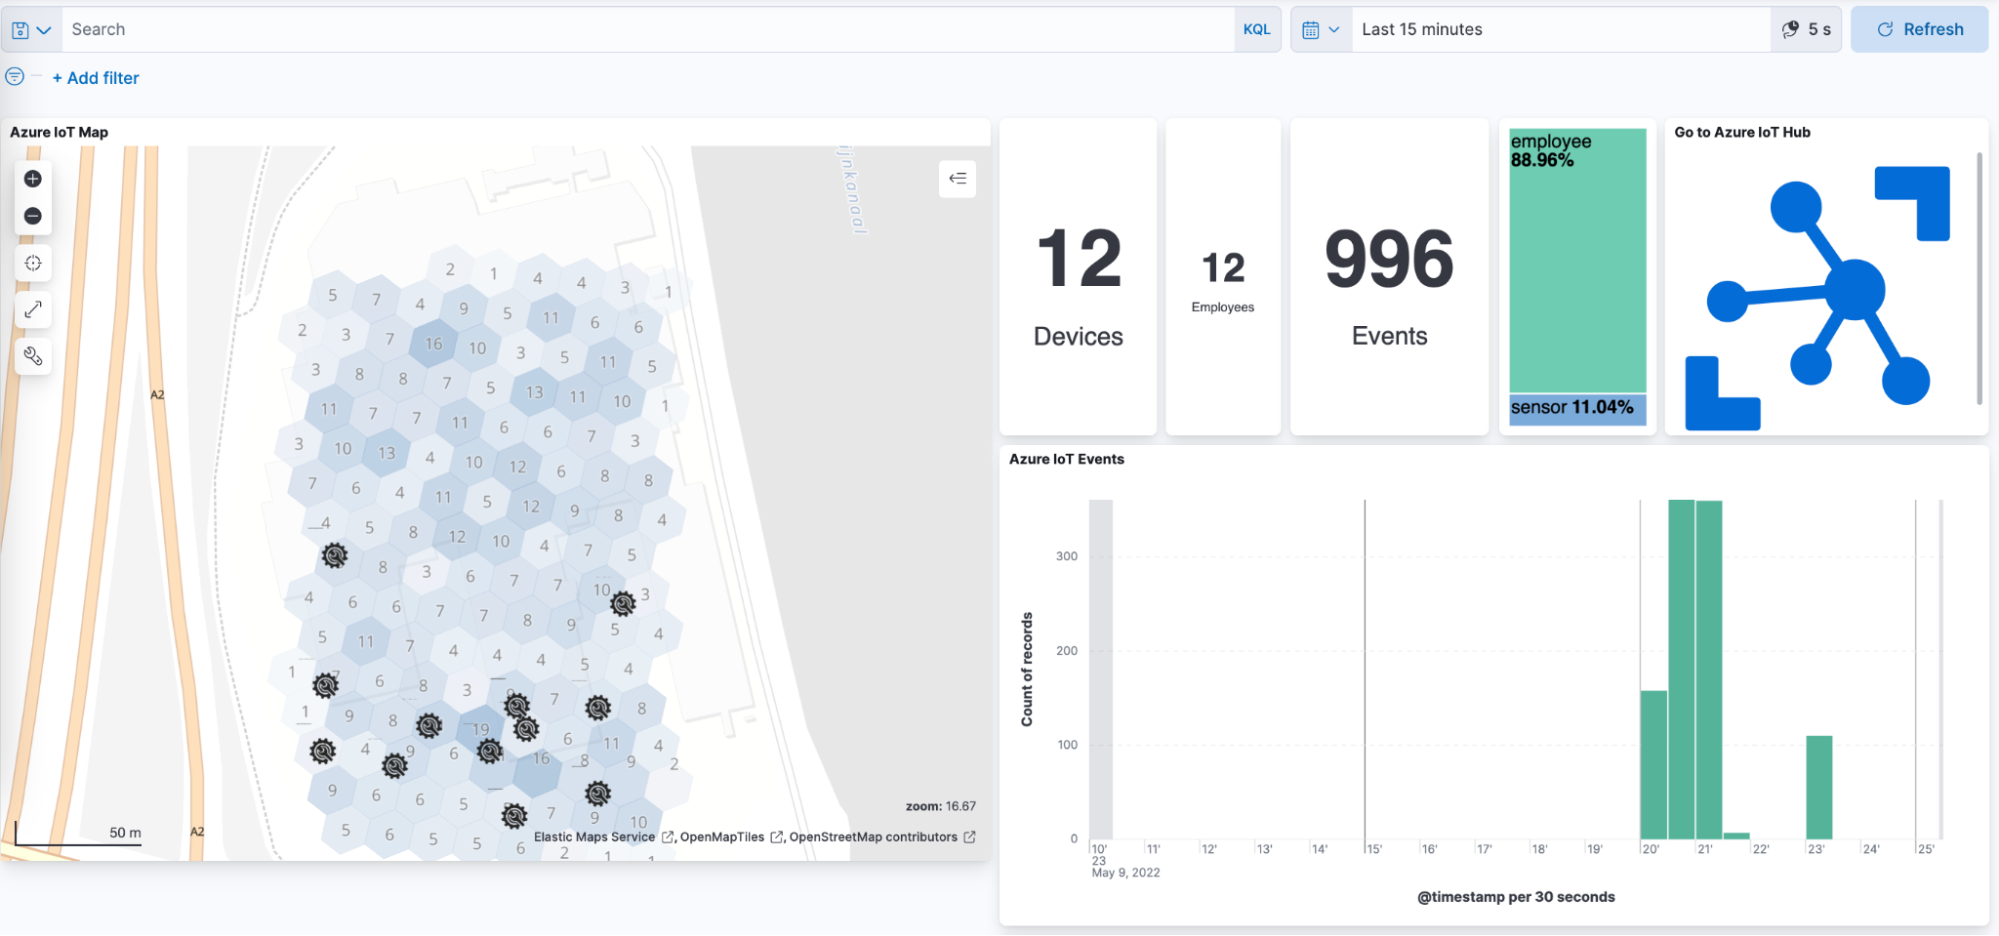
Once the data is flowing it is really easy to start creating visualizations and aggregations with the help of Kibana Lens:

And that wraps up this short but sweet IoT platform lab with Azure IoT Hubs and the Elastic Stack. We can do so much more from here with the help of all the features in the Elastic Stack, from analytics with Machine Learning to automation. Stay tuned for more on advanced use cases, as well as posts focussing on the Elasticsearch integrations with Amazon AWS IoT and Google Cloud IoT.